 CGQI
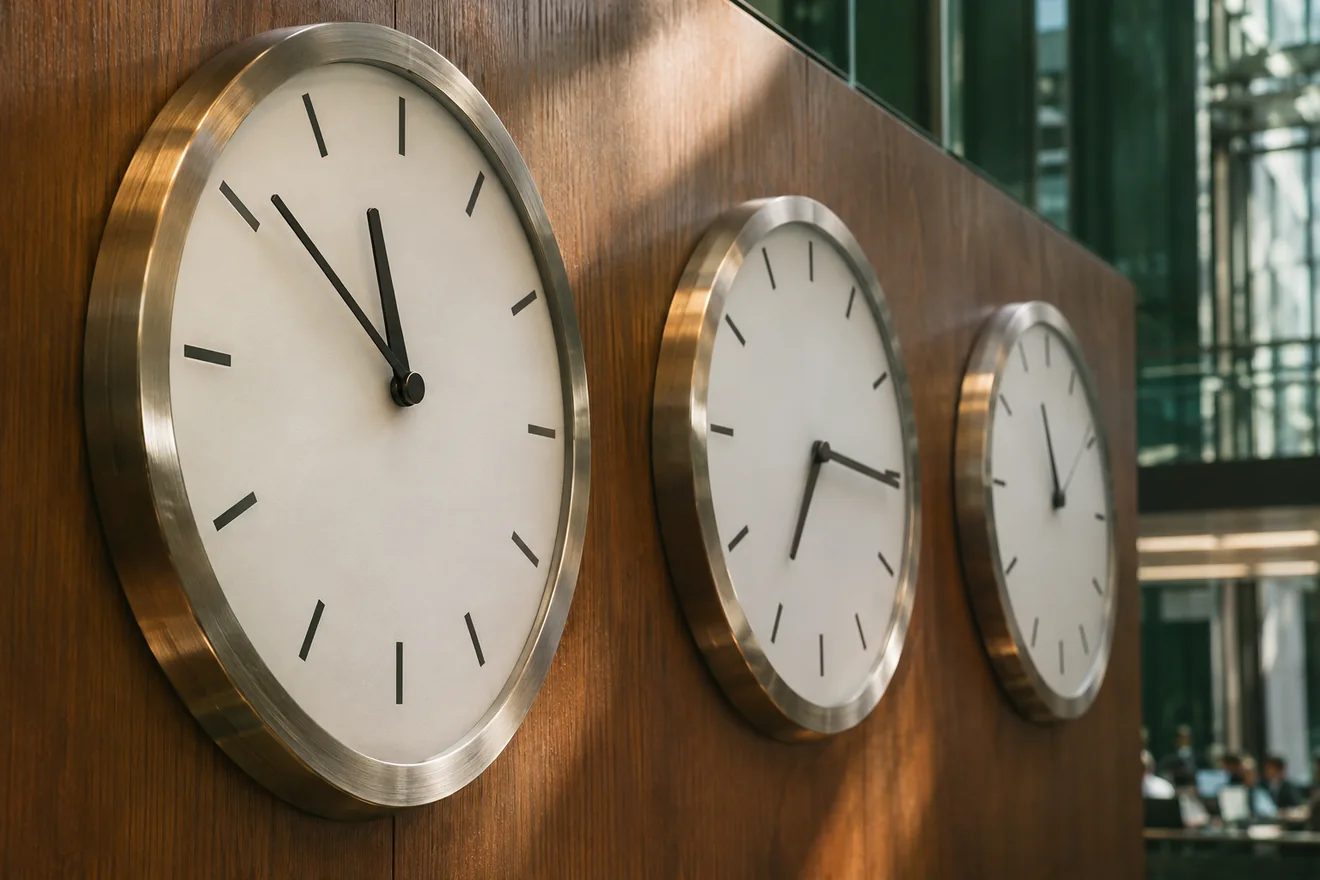
Start with the interval
A daily observation needs a venue, a time zone and a cutoff. The NYSE core equity session normally ends at 4 p.m. Eastern. A digital asset series sampled at midnight UTC has its own boundary. Before comparing the two, write down the start and end of each return window and convert both to the same time zone.
A Friday-to-Monday example
Suppose a researcher compares two series from Friday’s equity close to Monday’s equity close. A digital asset feed may also contain Saturday and Sunday observations. Pairing Monday’s one-day change in that feed with the equity’s full Friday-to-Monday change would compare different intervals. Take a snapshot of both assets at each shared endpoint, or report the weekend interval separately.
Keep a record of missing observations
A repeated Friday equity price on Sunday can be a carried-forward value. Treating it as a new trade can create a string of artificial zero returns. Keep the original timestamps, identify carried-forward prices and write down how missing values enter the calculation.
Read the result
A common interval makes the two changes comparable in time. Their exposures can still differ. For an equity total-return series, check whether dividends are included. For the digital asset series, record the venue and quote currency. These details belong beside the result so someone else can reproduce the comparison.